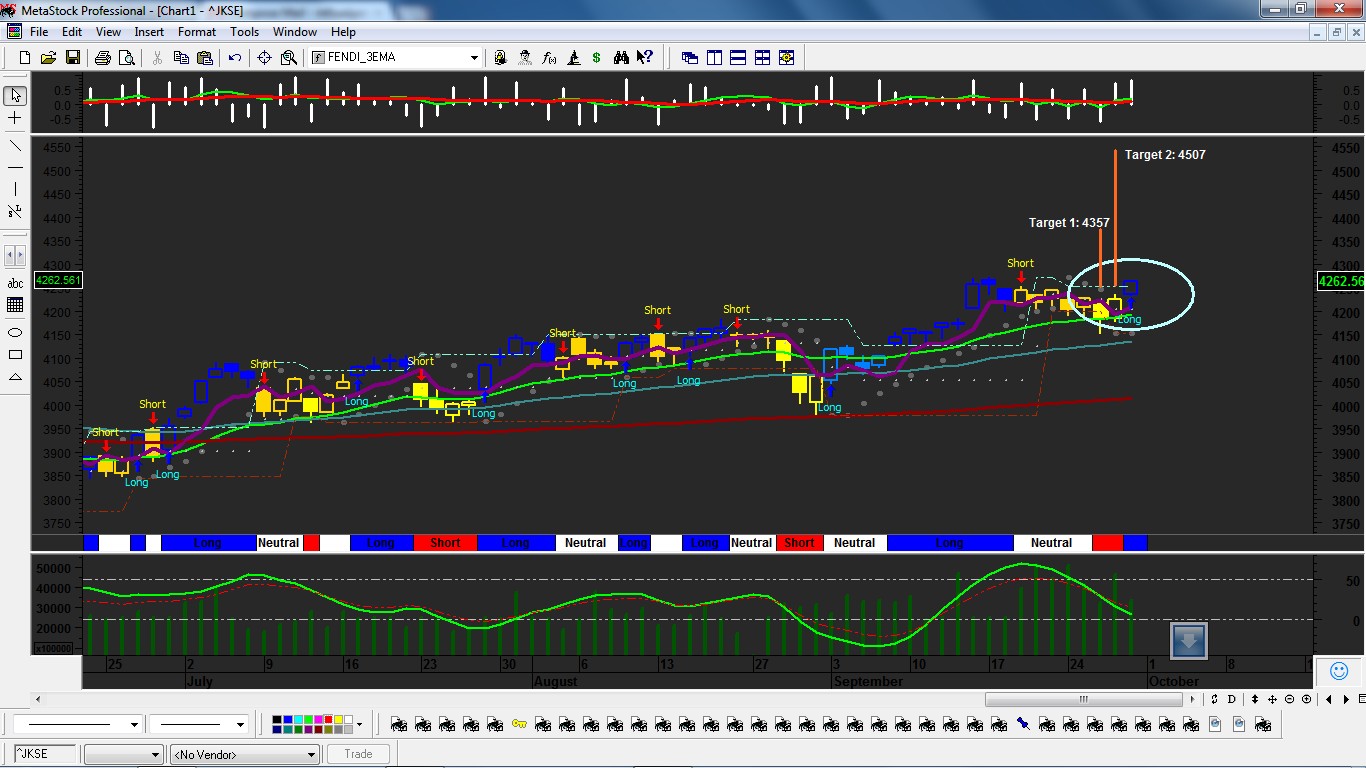
FENDI_Dynamic Strenght Expert Advisor
Analysis of Media Nusantara Citra Tbk (MNCN.JK)
Dated 9/28/2012
RECOMMENDATION : LONG/BUY since 11 period(s) ago
(rose by 15.56% )
"Fendi Dynamic Strength Indicator are indicators developed by Moh. Fendi Susiyanto that can be used to provide an indication to a "BUY or SELL" decision on a financial instrument/stock is assessed. Indications time to" BUY "will appear automatically in the form of an "up" arrow with Bar in a BLUE color , and the indication "SELL" will appear in the form of a "down" arrow with Bar in RED color. This indicator can also be used to interpret the conditions of overbought and oversold "
1. Crossover Between FDTS Indicator and its Trigger line (Crossovers)
Currently, Fendi Dynamic Strength indicator is in the LONG territory, because Fendi Dynamic Strength indicator moves above its trigger line.Fendi Dynamic Strength indicator crossed above its trigger line since 11 period(s) ago. Since Fendi Dynamic Strength indicator crossed its trigger line, the price of Media Nusantara Citra Tbk rose by 15.56% . The highest price is 2,600.0 and the lowest price is 2,200.0.
2. Dynamic Support dan Resistance
Current closing price is 2,600.00 , this clossing price is above its Dynamic Support price, which is 2,175.00, and above its Dynamic Resistance price, which is 2,275.00 and also above its Dynamic Pivot Point price, which is 2,433.33.
Failure swings on Indicator (Penetration on the Support and Resistance level or at a Breakout): FENDI Dynamic Strenght indicator has just reached its highest price since the last 14 periods ago, this is a bullish condition!.
3. Divergence between Indikator and Price
There is no signal the occurance of divergences in the last five periods.
4. Trend Analysis: Trend Trading For A Living
Currenty Media Nusantara Citra Tbk in the Strong Bullish condition . Currently, the closing price is above its 200 Periods-Exponential Moving Average (EMA), above its 50MA-Exponential Moving Average (EMA), dan above its 20 Periods- Exponential Moving Average (EMA).
5. Fendi Dynamic Strenght Overbought/Oversold Indicator
Currently, the price is in OVERBOUGHT condition.
6. Volatility Analysis
Volatility Changed
10-periods 47.4278 2.62
20-periods 42.9913 1.92
50-periods 39.9319 0.30
200-periods 51.3455 0.23
7. Trading Data
Opening Price : 2,500.00
Highest Price : 2,600.00
Lowest Price : 2,500.00
Closing Price : 2,600.00
Change (%) : 100.0 (4.00%)
Transaction Volume : 3,433,499,904 shares.
value of indicator (Fendi Dynamic Strenght) : 80.910
Signal Line : 69.365.
"There is a risk of Losses in trading"
Moh. Fendi Susiyanto
web: www.finvesol.com
e-mail: mfsusiyanto@gmail.com
(This commentary is not a recommendation to buy or sell, but rather a guideline to interpreting the specified indicators. This information should only be used by investors who are aware of the risk inherent in securities trading. We accept no liability whatsoever for any loss arising from any use of this expert or its contents.)